Theory of !resonances. Analog LLM.
Contact us.
e-mail:
  info@trallm.io

HOME             THEORY OF !RESONANCES               aLLM                                   


 Main
Theory of !resonances
TRIZ
aLLM

t!r Definitions
Resonances and synchronicity
External synchronization
Slots and i!l harmonics
!fluctuation
Le Chatelier
!Nonlinear bifurcation
!event flows
!flow !marker
!Cycle 3

Site News
aLLM beta testing.


Theory of !resonances is an active management framework that transforms
reactive response to the event flow into its predictive analysis and proactive regulation.

Physical Interactions in the Event !Flow: !Fluctuations and !Markers

The event !flow has a regular cyclicity and repeats with a definite periodicity. However, on the chart, one of the peaks can dip sharply into a deep minimum ("minus infinity"), while the rest remain roughly equal.

This is explained by the superposition of several !resonances at a single point. Physically, the !flow itself does not become "stronger," but in this specific time slot, a significantly greater number of physical interactions occur than in neighboring intervals of the same cycle.

In the theory of !resonances, these phenomena are categorized by their degree of impact on the system (a person or an organization):

  • !Fluctuations are large, critical events that exert a direct physical impact on the system.

  • !Markers are clearly discernible iconic events that serve as indicators of the !flow, but do not exert a direct physical impact.

Cascade of !Fluctuations and the Feigenbaum Tree

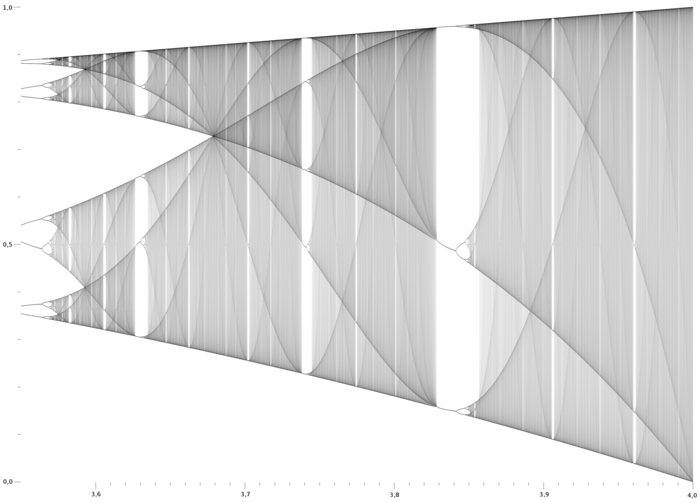
Within t!r, !fluctuations always occur in a series of three pulses (a fourth !fluctuation does not happen). This dynamics is clearly traced on the bifurcation diagram chart (Feigenbaum Tree):

  1. Compression of periods: The time interval between the 1st and 2nd !fluctuation is always longer than between the 2nd and 3rd.

  2. Feigenbaum ratio: The reduction of time intervals between !fluctuations obeys the universal constant: ~ 4.669

  3. Interval 1–2
    |----------------------|-----------|---> Entry into bifurcation
                              Interval 2–3
                      (~4.669 times shorter)

Passing Points of !Nonlinear Bifurcation

If we view the dark lines on the bifurcation diagram as the trajectories of event !flows, the reaction of the system to a cascade of three !fluctuations determines its subsequent trajectory:

  • Synchronous vector: If the system passes through the entire cascade of !fluctuations sequentially and in one direction, the subsequent event !flow becomes as smooth and gentle as possible.

  • Multidirectional vector: If the reaction of the system to the !fluctuations is chaotic or contradictory, the !flow changes direction abruptly and becomes "steep"—with high amplitude and instability.


t!r Tools

  Tools for !fluctuations
   Shift of !nonlinear bifurcation
  Fractality, cascades
   IFR according to TRIZ
  Working with what is
  !Entanglement
  Crisis as an evolutionary mechanism
  !Incoming
  !Outgoing
 

  Endocrine system
  Working with the endocrine system
Insight
  Dopamine +/-
  Acetylcholine +/-
  Adrenaline / noradrenaline
  Nothing to do
Abandon project
  Minimalism